Dashboard
The Dashboard is your at-a-glance view of what's happening: recent losses, quarter comparisons, activity, and suggested next projects.
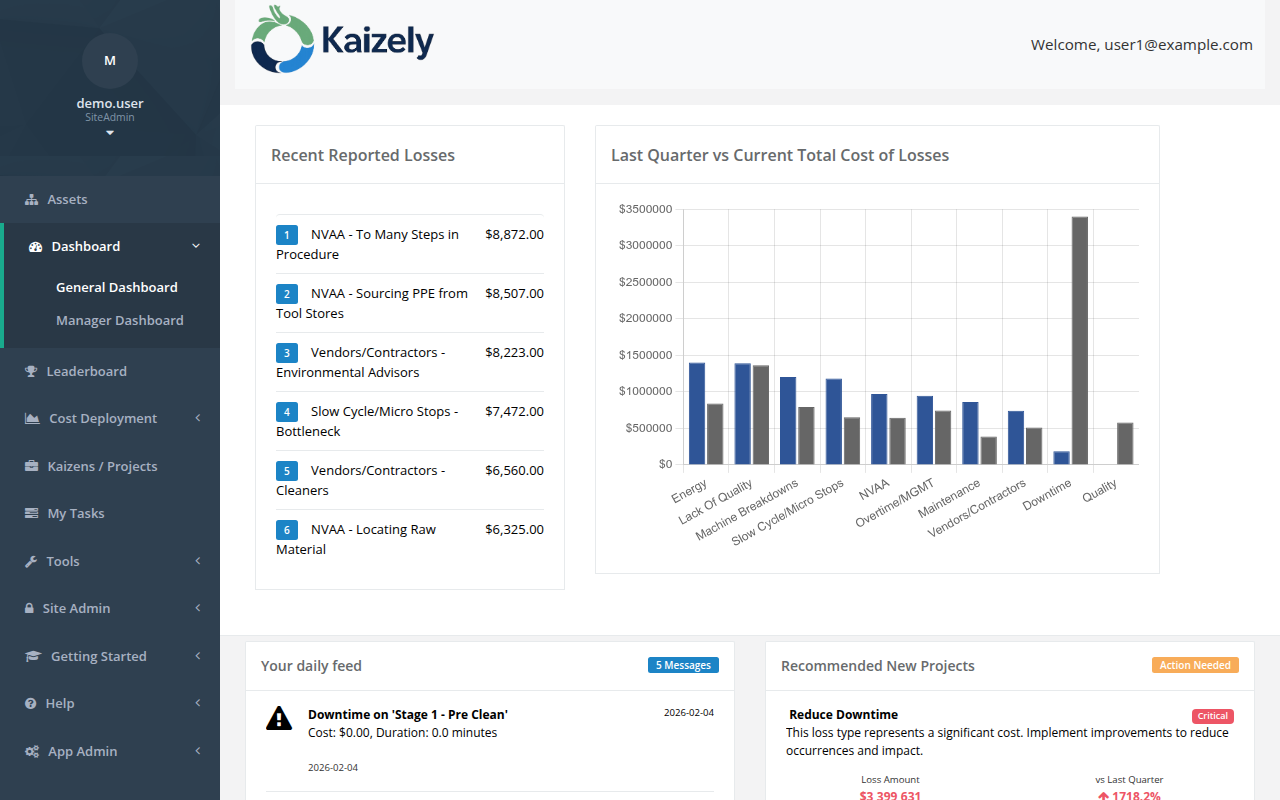 Dashboard — recent losses, quarter-over-quarter trends, daily feed, and recommended projects.
Recent Reported Losses
- Shows a short list of recently recorded losses for your organization.
- Useful for confirming data is flowing into Kaizely.
Last Quarter vs Current Total Cost of Losses
- Compares totals by loss type across last quarter vs current quarter-to-date.
- Use this to spot improving vs worsening loss types.
Your daily feed
The feed summarizes key activity from the last ~30 days, such as projects created/completed, tasks completed, downtime events, and benefits achieved.
Recommended New Projects
Kaizely can recommend projects based on loss cost and trends.
- Review each recommendation (priority, trend, and estimated loss amount).
- Click Create Project to start a quick-create flow.
- Select an asset from the list (top assets by last quarter totals for that loss type).
- If you’re a Site Admin, you may see an option to assign a project owner.
- Create the project. You’ll be prompted to open it immediately.
Tip: If you don’t see recommendations, confirm you have loss data for the current quarter and that your loss types are configured.