Cost Deployment
Cost Deployment pages help you visualize and stratify losses so you can prioritize improvement work.
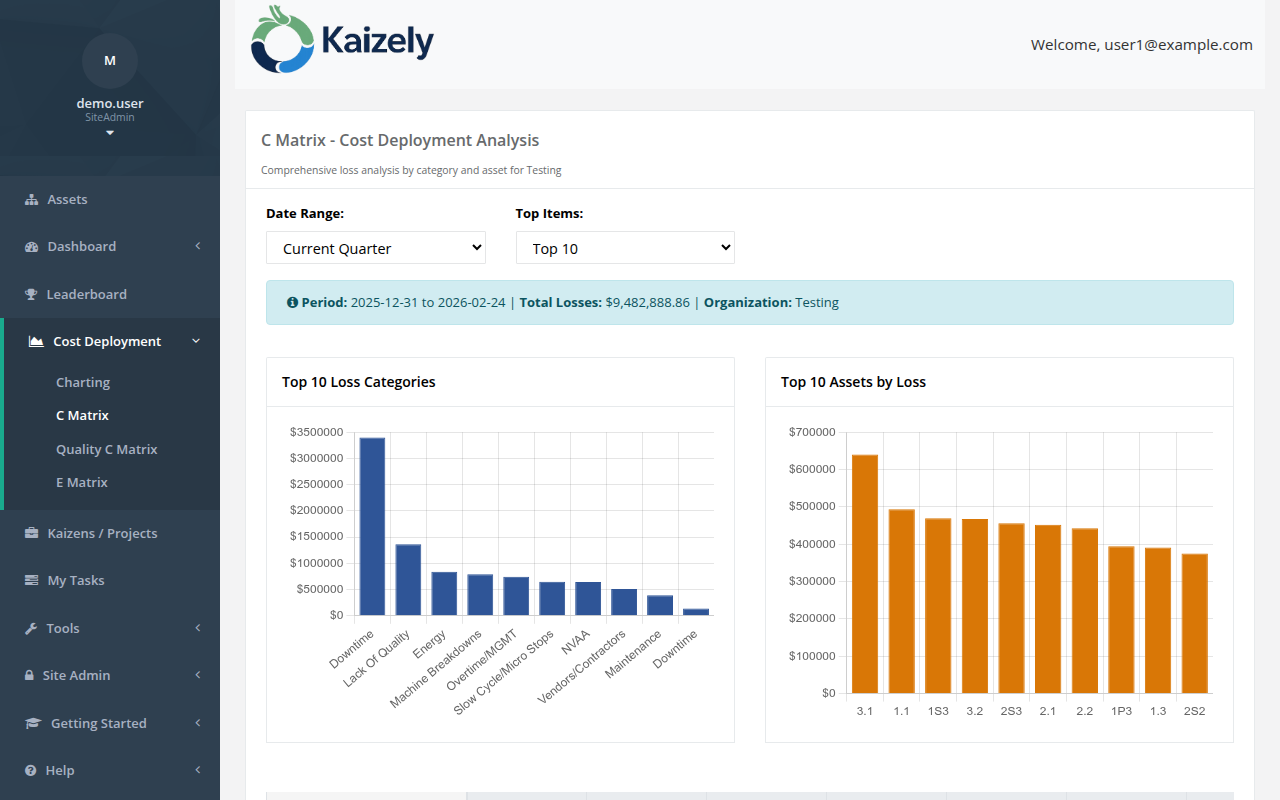 C Matrix — loss costs by type and asset, used to identify highest-cost categories.
Charting
Use Charting to explore loss patterns visually (by type, time, etc.).
C Matrix
- Shows costs by loss type across assets (organization-scoped).
- Use it to identify your highest-cost categories and where they occur.
E Matrix
- Operational view focused on downtime tracking and equipment effectiveness.
- Useful for monitoring what’s happening right now (including ongoing downtime).
Tip: If you don’t see meaningful numbers, confirm assets are configured and loss types/downtime reasons are set up.